
Handicapping Tutorial – Part 4
In Part 4 of the Handicapping Tutorial Series, we will continue to build on the head to head model that we debuted in Part 3. This will get deeper into the different situations we see in a football game and which ones are most important, but first, lets do a quick review of what the previous 3 Handicapping Series provided.
Handicapping Tutorial Summary
In Part 1 of the series, I provided all of the tools that I use most frequently in capping a college football game. As you create your model, or do any work in excel really, there are many of different shortcuts to make things faster. If you say to yourself, “there must be an easier way to do this,”…I can guarantee you there is.
In Part 2 of the series, I provided some detail of the different sources I use before the season, during the season, and after the season. Part of handicapping is filtering through the smoke and finding what is important, and what isn’t, while always remembering, there is never going to be much that completely deviates the outcome.
In Part 3, we finally got into the team vs team handicapping. I broke down how a football game is a sum of its parts, and how we can analyze those different parts to create an output.
Handicapping Series – Part 4
This part of the series will build off of Part 3. In part 3, we looked specifically at Team A vs Team B, and how they compare. We broke down teams performance by yards and by attempts.
We are going to take the model a bit further, and look at other components of a football game, and how they affect the output.
Field Goals and the Turnovers
So we saw how rushing and passing broken down into yards and attempts allows us to compare Team A vs Team B. The other two stats that I really look at are field goals and turnovers. There are some teams that kick less than 5 FGs per season (Oregon), and some that kick many more.
Building off of the projected score from Part 3, where we found the projected amount of passing and rushing TDs by Ole Miss vs. Bama, we can also incorporate FGs into the mix.
The FG stats that we have readily available to us are FG attempts and FG makes for both offense and defense. From there, we can derive FGs per game. So right now, this is what we are looking at in our projection for Ole Miss (first column) vs Bama (2nd column).
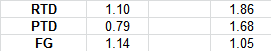
Obviously you can’t score 1.1 of a rushing TD, and you can’t score .79 of a passing TD, and surprisingly, you can’t score 1.14 of a FG either. We will get into this topic in a bit, but the last thing I want to incorporate into our projection is turnovers.
Now, this is a skewed statistic due to a few things, but mainly luck. In the long run, a fumble should be recovered by Team A 50% of the time, and Team B 50% of the time. Some teams in certain years are just better at hawking the ball than others. For example, LSU with Tyrann Mathieu was insane. They had great turnover luck, and their turnovers impacted the game greatly.
The other situation is turnover return yardage. It is impossible to say, or predict how far an interception or fumble will be returned.
From the past 5 years, turnovers have accounted for about a 10-15% decrease in score for a certain team according to my research. Because we collect data for offensive and defensive interceptions and fumbles, we can once again find a projected average amount of turnovers for team A vs team B.
Once we have the projected amount of turnovers, we can decrease our projected score by XYZ amount x 10%. This gets us to our final score projection for the game, but this isn’t the end. In the Ole Miss vs. Alabama game, here is where we end up:

We once again see that there are projected amounts that are not whole numbers. This is where the human capping comes into play in my system, and we will touch in depth on that in Part 5. I will give some idea as to where this is going though, and how we will adjust the score.
In a football game, there are stats that are statistically more significant than others. To find this out, I run a correlation on pretty much every team stat. I compare these stats with scoring and winning. Its easy to do in Microsoft Excel using:
=Correl(Query1,Query2)
We will use the important stats, and a teams performance in those categories, to adjust a projected 1.68 passing touchdowns, up or down.
In Part 5, I will get into the different correlations that matter, as well as the coaching model I developed and used. Once we adjust the above score, we can assess our value, and therefore, win lots of money.
For analysis, commentary, plays and randomness, follow @mtsabert on twitter.


7 thoughts on “Handicapping Tutorial – Part 4”
Leave a Reply
MAXIMIZE YOUR EDGE

SabertStxVii, thank you so much for this series! I am sure there is a lot more to being a successful handicapper but for a newbie like me, you have provided the foundation… THANK YOU.
QUESTION: How do you adjust the model when a team like Iowa has NOT allowed any rushing touchdowns on Defense? Putting in zero ends up actually favoring the opposing team (this case Minnesota) in terms of Rush Yards/Rush TD and Rush Attempts/Rush TD.
PLEASE HELP!
good question.
I typically will put an If((vlookup(XYZ)=0),.1,vlookup(XYZ))
Basically this is saying, if they still havent allowed a TD, just put .1 in there and calculate it from there. Hopefully after this week, we should have eliminated most of those scenarios.
Hope this helps.
Thank you sir! Really appreciate your help. Good luck!
Why are you factoring in turnovers? aren’t they already factored in? can you please explain. thanks in advance.