
Handicapping Tutorial Series – Part 3

In part 2 of the Handicapping Tutorial Series, I touched on all of the different sources that I commonly use to handicap a football game. In Part 3, we will look under the hood of the Black Box, looking at how to set a basis for a statistical handicapping model.
Yards
In the great game of football, we have a common denominator. Unlike sports such as hockey and soccer, football has a bottom line, that allows us to compare Team A to Team B. That denominator is a yard. In football, to move the ball and score, a team needs to pick up 1st downs. To pick up first downs, the team needs to pick up yards. Every part of football can be broken down into the yard component.
If I told you that a team rushed for 430 yards in one game, you should generally be surprised or impressed. If I told you that team was Air Force or Georgia Tech, a team that runs the ball 90% of the time, and only throws for 80 yards a game, you are much less impressed.
My model starts with breaking down statistics into yards. I break it down as many derivatives as possible. The stats that I use to start the predictive model are Rushing Yards per Rushing TD, Passing Yards per Passing TD, Yards per Rush, and Yards per Pass.
Attempts
Another common denominator in the game of football is attempts. How many tries does it take a team to reach their goal, the end zone. I have similar stats I use as well regarding attempts and they are: Rush Attempts per Rushing TD and Pass Attempts per Passing TD.
Both of these statistical measures, on both sides of the ball, are used in my predictive model.
The Model
In the game of football, we have two teams that go against each other. For the rest of the tutorial, I will use Ole Miss and Alabama as the two teams in this model (when I keep referring to Team A and Team B, it can get confusing). Like mostly all sports and things in life, events typically revert to the mean. What does this mean?
Well, If Alabama’s defense saw about 30 rush attempts per game on average and Ole Miss averaged 42 rush attempts per game, you have to imagine they may meet somewhere in the middle. Why? Well, if I told you that a team rushed the ball 60 times against Alabama, you would think one of two things: 1. The team that rushed 60 times runs an option-based offense or 2. Alabama really sucks at stopping the run. Option 1 adjust for a teams scheme and Option 2 adjust for a coaches game plan.
So the model logically pits Ole Miss’ offensive stats against the defensive stats of Alabama, and vice versa. The important stats we are looking for, are the stats I explain above, or you can see a sample below.
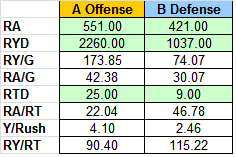
Team A: Ole Miss, Team B: Alabama
Now just looking at the raw stats doesn’t tell me much of the story, its retroactive, and unsuccessful gambling models tend to look at prior events, not future. What we need to do to have a successful analytic model is have it be predictive.
In the model above, we see that Ole Miss rushed the ball 551 times on the season, while Bama was only rushed on 421, coming out to 42.38 and 30.07 attempts per game, respectively. Ole Miss averaged 173.85 rushing yards per game and scored 25 TDs on the season, compared to Bama’s D allowing 74.07 per game and only 9 TDs.
The important stats are the towards the bottom. They help us build the predictive model.
What are we trying to predict?
It seems obvious, but we are going to deduct how many rushing TDs Ole Miss will score.
The first stat we need to predict is how much Ole Miss will rush the ball against Alabama. I honestly use a simple average. I will talk in later Series about certain adjustments that can be made, but for intensive purpose, I am just averaging 42 and 30, to get 36.23 rush attempts by Ole Miss.
Next I am trying to predict how many yards Ole Miss will have against the Tide. To find this number, I am taking the 36.23 rush attempts that are projected, and multiplying that number by the average Y/Rush of Ole Miss offense and Bama D. That projects 118.92 yards.
Now that we have the yards, we can finally project how many TDs Ole Miss will get on the ground against the Tide. To predict this, we will use the two numbers we just found, 36.23 rush attempts and 118.92 yards, as well as the averages of Rush Attempts per Rushing TD and Rushing Yards per Rushing TD.
The formula I use an Average of: 118.92 / Average (Ole Miss O and Bama D RYards / RTD) and 36.23 / (Average (Ole Miss O and Bama D RAttempts / RTD). It sounds more confusing written out than it actually is, and the numbers come out to 1.10 Rushing TDs.
Conclusion
The same logic can be applied to the similar passing stats as well, to predict passing touchdowns. What we are attempting to do is predict the final score of a football game. To do that, we need to know how many times, and by what methods a team will score.
Now many of you may have already asked yourself, “How the heck can a team score 1.1 Rushing TDs?” You obviously can’t, and this is where my model begins to take on a human touch.
In the next Handicapping Series, I address how turnovers, penalties, and FGs affect the predictive model, as well as the human component.
…and by the way, Ole Miss rushed for 80 yards and 2 TDs on 35 attempts against Bama this year.
For analysis, commentary, plays and randomness, follow @mtsabert on twitter.


6 thoughts on “Handicapping Tutorial Series – Part 3”
Leave a Reply
MAXIMIZE YOUR EDGE

SabertStxVii, how do you incorporate these statistics on teams in Week 1, and for that matter all the earlier weeks of the season? If you use previous seasons stats for handicapping earlier weeks of season, how do you account for losses to graduation? Also, when starting to include the stats from the current season what do you do about scheduling differences such as a team having gawdy numbers due to playing a weak defense?
BK — sorry for just getting back to you. I tried to do it awhile ago, from a different computer, but it just wouldn’t let me.
In future post, I will get into how I adjust for the beginning of the season and when I start to include the current season stats.
SOS is such a hard thing to judge in CFB, or in any sport, because it is a circular reference. Team A played Team B, but Team B played Teams C and D. So does that mean with the transitive property Team A played teams C and D? Thats tough to say. One way to combat this is by using power ranks. What is the average Power Rank Value of teams a certain team plays. I will also get more into this as well. When we look at correlation in future post, we will analyze the teams overall NCAA rank, as well as the conference rank. We can then get a ranking for each conference, which gives us another way to view SOS.
Thanks for following, and look for Part 4 later this week.
The formula I use an Average of: 118.92 / Average (Ole Miss O and Bama D RYards / RTD) and 36.23 / (Average (Ole Miss O and Bama D RAttempts / RTD). It sounds more confusing written out than it actually is, and the numbers come out to 1.10 Rushing TDs.
can u write this formula out? Im lost in a mental fog of assumption but does () mean divide or multiply? you also have an (and) between the two equations, how is this equation properly computed?