
A Breakdown of My Spread Projecting Formula

Before starting the season, I wanted to give TSE readers a chance to understand the “Method behind my Madness”. After all, I promised you transparency and objectivity. I strongly recommend that you read this article to gain a better understanding of why I select certain games.
By grasping the overall concept, you can also gain supplemental information for games that you may be considering in lieu of playing all of my selections. The information contained in this article is extremely valuable in my opinion.
To recap, I use a disciplined money management technique, and I combine that with an objective approach based on statistical analysis. Not only do I want to make money, but I also want to prove that my formula provides a decisive advantage in the long run. I will never tell you that any particular game is a guarantee, because there’s no such thing in this industry. It is important that you maintain a level head throughout the season as there are often many hot and cold streaks. However, If you are able to stick with the system, I firmly believe that you will win more often than you will lose.
My calculation is based upon a weighted average of a number of variables, but the primary driver is Passer Rating Differential. To be blunt, no statistic has proven to be more significant than Passer Rating Differential over the last 30+ years. If you want to learn more about why I chose this statistic I encourage you to email me (I will also provide you with a correlation analysis of ATS success and Passer Rating Differential as the season approaches!).
Here is the Strategy to my Spreadsheet:
Each week, I provide my calculated version of the spread. I then compare my calculation to the actual Vegas line. The difference between the two dictates which tier each game falls under.
I have broken up my calculations into 3 tiers:
“The Coin Flip Tier” (the difference between my calculated spread and the actual spread is less than 2). Games that fall into this tier are essentially too close to call. Vegas’ point spread is almost perfectly aligned with my calculation. Therefore, there is no statistical advantage in taking one team over another. Historically, my projected winners have won just above 50% in this tier. I generally avoid taking games that fall within this tier unless I feel very strongly about another variable within the matchup. I often consider many games within the “Coinflip Tier” to be trap bets if the betting public heavily favors one team without any line movement.
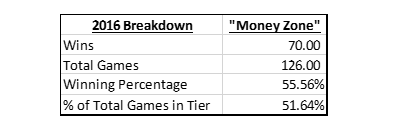
“The Money Zone” (the difference between my calculated spread and Vegas is between 2-6). This tier is the wheel house for the majority of my “Shorestein Says” Picks of the Week. Historically, games that fall within this tier, have hit above 55%. I consider games in this tier to have a statistical advantage in the long run. Since I’ve been running the formula, about half of all games fall within this tier. I usually select my favorite games within the tier based on additional on-field analysis, team trends, Vegas line movement, and experience to hopefully succeed even higher than the 55% noted above. The chart below shows how games within “The Money Zone” performed in 2016:
“The Outliers” (the difference between my spread and Vegas is 6 points or higher). This tier is the complicated one. In theory, since the variance is so high, it would imply that these games would have the most statistical value…. However, it is actually the complete opposite. I have learned that no statistic is perfect. If Vegas’ spread is completely different, there is often a convincing reason or mitigating factor as to why it varies so greatly.
So rather than being stubborn with my calculations, I have accepted defeat to the powers in Vegas on games within the “Outlier Tier”. The phrase “If you can’t beat ’em, join ’em.” applies perfectly here. The records in this tier if you play the OPPOSITE of the projected winner of my calculations were:
2015: 23-12 (65.71%)
2016: 28-12 (70.00%)
Because of these eye-popping records and the mitigating factors I have outlined below, I will encourage that you play the opposite of the projected winner when the spread calculations yield a difference greater than 6.
Here is a list of mitigating factors as to why the spread calculations in some games are thrown so far off:
-There are certain teams that can overinflate their Passer Rating Differential statistics (2016 Vikings and Broncos). Quarterbacks that have a tendency to take more sacks end up with a better QB rating even though it hurts their actual team’s chances of winning. This habit often over rates a team’s offense and can ultimately skew their team’s point calculations. A great example of this was Sam Bradford’s season last year. If you watched the Vikings’ offense you could clearly see that it was extremely flawed. They finished 17th in 3rd down %, 23rd in points, 23rd in Sacks Allowed, and 28th in Yards Gained. However, when looking at Bradford’s rating of 97.7 (ranked 7th), you would think the Vikings’ offense would be formidable. Clearly, this statistic can be flawed at times.
-There are also some games that completely skew entire seasons worth of data (2016 Jets and Seahawks). Anytime a quarterback has a single game where there are 4+ interceptions thrown, it will likely adversely affect the team’s rating for a majority of the season. In reality, these games are often blips on the radar. Therefore, it is difficult to penalize a team for a whole season for a handful of bad throws. 2 examples of these statistical anomalies were the absolute beatings that the Jets took against the Chiefs, and the Seahawks took against the Packers.
See the table below:
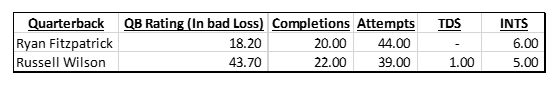
Fitzpatrick’s miserable game created some head scratching spread calculations for the Jets in many of their early matchups. Wilson’s bad game in Green Bay also unjustly weakened many of the Seahawks’ future games down the stretch.
– Quarterback injuries obviously are a huge mitigating factor for data purposes. When a QB like Roethlisberger misses a few games there is certainly the potential for adverse calculations.
In a given week, the majority of games fall within the “Coin Flip Tier”, and the “Money Zone”. There are usually just a couple games that land as outliers. I don’t expect the Outliers to continue to succeed at such a high rate, but I believe the sample size is too large to ignore at this point.
Here is an example of Week 14 from last year:
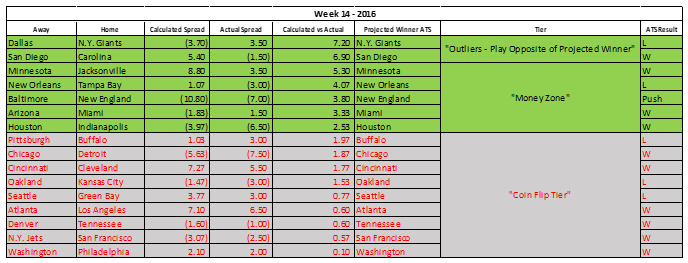
Money Zone Example: The column for “Calculated Spread” is from the Home Team’s perspective. At the 6th row of the chart, my calculation is calling for the Dolphins to be 1.83 Favorites against the Cardinals. The “Actual Spread” is Dolphins +1.5. Therefore, the variance is 3.33. Since this game is within the “Money Zone”, I would recommend taking Miami. The Dolphins ended up winning 26-23.
Outlier Example: The column for “Calculated Spread” is from the Home Team’s perspective. At the 2nd row of the chart, my calculation is calling for the Charges to be 5.40 Favorites against the Panthers. The “Actual Spread” is Panthers -1.5. Therefore, the variance is 6.90. Since this game is within the “Outlier Tier” I would recommend playing the opposite of my projected Winner, which would be the Panthers. The Panthers cruised to a 28-16 victory.
The “ATS Result” column considers playing the opposites of the projected winners in the Outlier tier.
Week 14 was a great week for the spreadsheet, even in the “Coinflip Tier”. Of course, not all weeks work like this. But playing my spreadsheet the way I recommended would have earned you a record of 134-104 in 2015 (56.30%), and 143-101 in 2016 (58.61%). And these fabulous records are before I consider my other variables in selecting games. I find that using this spreadsheet is an excellent way to start looking at games to target for a specific week.
I hope you enjoyed my analysis, and I am more than happy to discuss further if you have more questions. I look forward to the season as it gets closer and closer!
Thank you!
Nicholas Shorestein is an NFL writer & handicapper. He writes about NFL analytics and handicapping for The Saturday Edge. He also writes about the NFL on his blog ShoresteinSays.com. You can follow him on twitter @n_shorestein.


MAXIMIZE YOUR EDGE

0 thoughts on “A Breakdown of My Spread Projecting Formula”