Betting Spreadsheets 101: The Basics
This post assumes a basic level of familiarity with Microsoft Excel. I would suggest opening Excel and trying to replicate what I explain below. If you run into issues, feel free to contact me.
I love Microsoft Excel. It’s such a great tool for handicapping. I’ve built countless betting spreadsheets from super simple to incredibly complex. The great thing is that sometimes the simple ones are the most useful. They all utilize certain tools and features Excel has to offer, and I’m going to show you some of what I consider the basics.
Data From Web
If you weren’t aware, there’s a better way than just copying and pasting some stats from a website into a spreadsheet. Excel has a tool you can use to simply reference a website (there are other sources to import from, but most of the time, I’m referencing something from the web) and import the data into your spreadsheet.

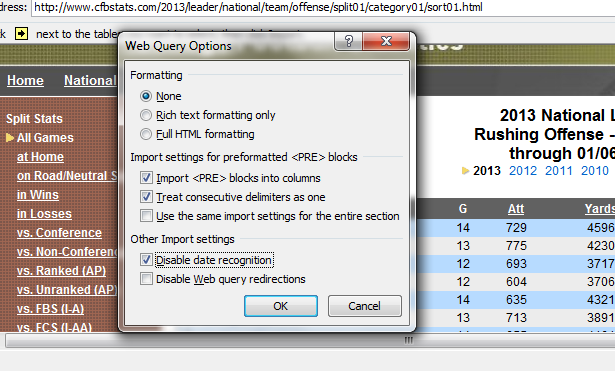
As you can see, a browser opens and you can navigate to any website you want. I’ve used cfbstats.com as an example. A couple of tips:
If you simply want to import the whole page, you can click on the “Hide Icons” box and push import.
For sites like cfbstats.com that have nice tables, you can click the yellow arrow within the browser to the respective table you want to import. Not all websites give you this option, but finding sites that do will make most of your lives easier.
The only option I generally mess with is disabling date recognition. This is helpful when you are importing records such as a table of ATS records. If the box is not checked, most likely it will import the records as dates. Check the box and your problems are solved.

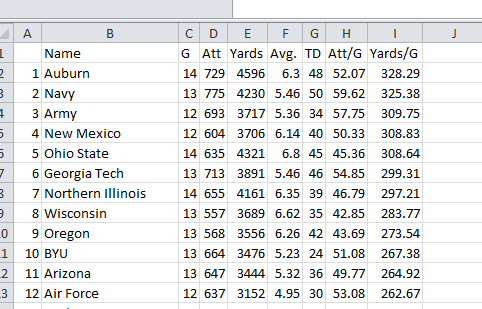
So once you click import, you’ll be prompted to select a cell to place the table you’re importing. I selected A1, and the table then imports.
Now that we have some data in Excel, we can start to use some functions to manipulate it into something useful.
Using VLOOKUP
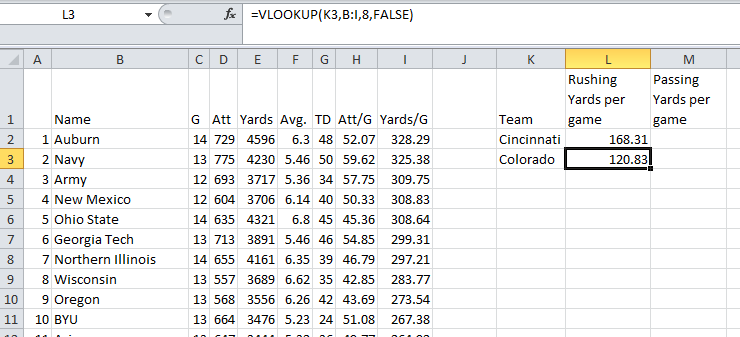
There are several lookup functions you can use, but the one most people usually learn first is VLOOKUP. You may want to use Excel’s help menu on this function if you’ve not used it before. In general, I find Excel’s help menu on functions very helpful. I’ve learned a lot this way and think you will too. But back to VLOOKUP. We brought in rushing stats for all FBS schools. Let’s say we were really only concerned with Colorado and Cincinnati’s stats. I added some text off to the right of our imported table.
You could manually go through the imported stats and get each team’s rushing yards per game, or you could automate this by using VLOOKUP. In our case, we would want our function to be VLOOKUP (“team”,”team’s stats”,”column of stat to display”, “exact match”). In formula format, it would look like =VLOOKUP(K2,B:I,8,false). You can copy formulas down for each team and the formula will work, but make sure you lock rows/columns as appropriate in your spreadsheets. If you don’t, you may end up referencing incorrect fields. Check out this video if you are unfamiliar with this concept https://www.businessinsider.com/excel-dollar-sign-absolute-reference-2013-7.

This is a very basic example of how you can use these two tools. To see if you understand, try doing the same thing for passing yards per game and see if you can successfully bring in those stats from cfbstats.com. The options are really endless with what you can do. Want to bring in ATS records, schedules, current spreads, drive data, individual play data, box scores, etc.??? After getting comfortable with Excel, you can really do pretty much anything you want. Well, almost anything. Here’s a snippet of my weekly “cheatsheet” that automatically populates each week to give you an idea of something you can build. There are several more columns with other data as well. It’s been a great tool that has saved me a lot of time each week when looking over the weekly slate of games.
Have other tips or have questions? Want something built but don’t know how to do it? Comment away.
Tags Betting Resources


What website are you using to query ATS, total and SOS data?
Covers.com works pretty well. For SOS, you can try Sagarin if you don’t have your own. It imports pretty well. The problem you may encounter is that naming isn’t perfect across each different site. I set up a naming table in cases like these and use INDEX and MATCH to make sure everything gels together reference wise.
Can you save the web query to do it automatically? How to use the Vlookup function to reference data on another sheet?
Thanks.
Once you set up the web query, you don’t have to keep setting it up over and over again. You can refresh it a few ways, the easiest two being just right clicking anywhere in the imported table and clicking “refresh” or on your keyboard you could hit Ctrl + Alt + F5 which will actually refresh all your web queries. If you have a lot of them, sometimes Excel freezes up, so it’s best to use a macro to go through them one at a time (more on this topic in a later post).
You can actually use VLOOKUP and other functions in other tabs as well as completely different spreadsheets. When you’re in your formula, just click to the tab or worksheet that has the data you want to reference and it will allow you to do what you want. A little easier doing this than just typing everything in manually. So have both the spreadsheet you’re working in and the other spreadsheet open, and you should be able to reference. I can provide some screenshots if you have issues.
Thanks for your help. Do you know a good site to web query schedules?